How to Evaluate Content Performance (And Make It Better)
Not seeing results from your content marketing?
It’s a common problem, but it’s not difficult to fix.
If you’re running an inbound marketing strategy, you know that content—whether via a blog, infographic, podcast, video platform, or social media—is the lifeblood of your strategy.
But you can only push ahead without results for so long.
If you’re not seeing results, it’s time to take a step back and evaluate your content performance.
Today, we’ll look at how to do that. By the end of this article, you’ll have the tools you need to set a powerful content strategy that almost guarantees results.
Let’s dive in.
Decide on Your Goals
Before you can analyze and start improving your content marketing strategy, you need to understand what your goals are.
This will allow you to refocus your marketing efforts on what really moves the needle for your business, allowing you to work smarter and not just harder.
To set your goals well, you’ll need to define both leading and lagging indicators.
A lagging indicator is usually the ultimate objective but comes about as a result of other actions—think revenue or profit.
A leading indicator is more directly in your control but does not bring bottom-line results as quickly. This might be social media followers or website visitors.
Both are important to growing your business, and you’ll need to establish key performance indicators (KPIs) for each one.
There are as many sets of KPIs as there are businesses. In this piece, we’ll explain the most popular types using the idea of moving down the funnel.
We’ll look at ways in which you build awareness and attract new customers, get them interested and engaged in what you’re offering, build their desire to convert, and finally how those actions lead to revenue.
How to Attract More Visitors and Followers
When we think of content marketing, we often think of the attract stage. It can be the most interesting and is certainly the easiest to explain.
At this part of the funnel, content is centered around finding new customers.
This is a key role for content and one that likely takes up the lion’s share of your time. According to Databox, content marketers say that they write 53% of their content to attract new visitors.

The two most common methods to do this are social media and search engine optimization (SEO), but there are others as well.
Social Media
One of the easiest ways to build brand awareness is through social media marketing.
You can transfer nearly every type of digital marketing strategy to a social media platform. Whether that’s paid channels, organic views, or even a guerilla marketing strategy it all can work.
Two of the most important ways to measure your success with social media marketing are through traffic sources and social shares.
With traffic sources, you can easily see if social channels are worth pursuing. For example, the website Wait But Why gets 40.25% of its traffic from social media, making it a highly valuable channel.

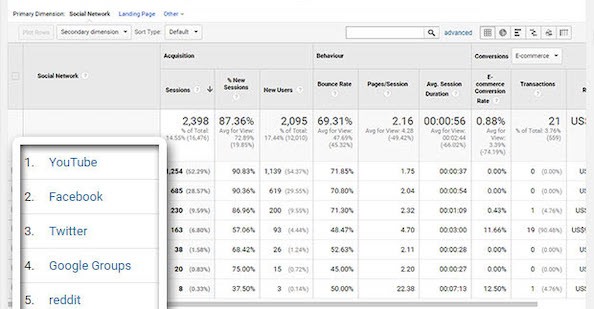
Many analytics tools can help you find which specific social channels are sending the most traffic. Take a look at this screenshot from Google Analytics. It shows that YouTube is the primary social media channel for this site sending nearly double the amount of traffic as its nearest competitor, Facebook.
Second, look at social shares. Where social traffic shows the flow of social media visitors to your content, this metric shows the number of times your content has been shared on social media.
Combined, these two data points will help guide you to create a more effective strategy that attracts a new audience through social channels.
SEO
For most of today’s content marketing, getting a higher ranking in Google and other search engines is the primary goal.
And for attracting new visitors, few channels present so many opportunities.
The biggest lagging indicator for SEO is your placing on the search engine results page. This is easy to measure—second place is better than third place, and so forth—and you’ll see measurable benefits each time you improve.
A secondary lagging indicator is domain authority. As your site builds credibility, your content marketing efforts across the domain will improve.
And perhaps the single most important leading indicator for each of these is the number of inbound links you build to each page on your site.
Other Media Sources
While social media and SEO are the two most popular ways to attract traffic, this section would be remiss without mentioning two other kinds of content—podcasts and videos.
Podcasts are notoriously difficult to measure. Unlike videos and text content, which are usually streamed or viewed on a platform with analytics, podcasts are downloaded—and then disappear from your dashboard. There’s almost no way to learn how people listen to those downloads.
That said, some important KPIs for podcasts include unique downloads and subscribers. If you have other ways to engage with users, such as a presence on social media or Patreon, you may want to track KPIs from these platforms as well.
KPIs are more straightforward for video.
According to Google, the most important KPIs for the awareness stage are views, impressions, unique users, and awareness and ad recall lift.

Many times, you’ll want to compare these key metrics across channels. Your videos may be viewed via social media, which affects your SEO ranking, and vice versa.
Once you have a good idea of which KPIs matter most for the attraction stage of the funnel, it’s time to move onto engagement.
How to Measure User Engagement
While attracting new visitors is critically important, it’s not enough.
That’s why the next stage in the funnel is engagement. That is, measuring the interaction of your audience with your content.
Those who engage with your content are more likely to convert, buy, and become loyal customers. Here’s how to keep track.
Perhaps the most common KPI is pageviews. This metric allows you to see the number of times a user has viewed a page. You may also consider unique pageviews, which only counts a page for each session.
Another popular KPI related to pageviews is the bounce rate, which shows the percentage of people that leave your site after viewing just one page. Average figures vary wildly, so it’s a good idea to compare bounce rates by industry and content type.
You’ll also want to measure time on site. The higher the number, the more engaged your visitors are. Two minutes or more is a good target, but it depends on the context of your site and visitors.
Finally, you can use heatmap software like Hotjar to see how much people read on your page. This can be helpful as you decide your page structure and where to place what matters most.
Engagement is great, but it’s at the next stage that the most important change takes place—getting a casual visitor to convert.
How to Track Your Content Conversions
How you define a conversion depends largely on your industry and goals, but in this section, we’ll cover the most common types of conversions and explain the most important KPIs for each one.
One way to ensure you’re getting the conversions most important for your company is to check the behavior flow of your visitors.
In most analytics programs, including Google Analytics, you can see how visitors are moving around your site. Look for areas in which you can optimize this flow.
Perhaps the most common call to action for content is to sign up for an email list. In fact, according to LYFE Marketing, 64% of companies rate email marketing as the most effective channel.
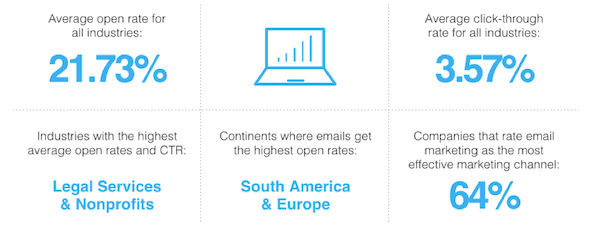
As you work to build your email list, ensure that those conversions are true subscribers. Compare your delivery and read rates based on other industries to track your progress.
A further step than an email list would be to start collecting leads—that is, visitors with a defined interest in purchasing down the road.
The primary lead generation KPIs here should be the number and quality of your leads, as well as the conversion rate from different pages on your site.
If you’re not seeing a large number of leads right now, don’t worry too much. What’s important is that the number of leads keeps growing.
Compared with paid search, content marketing has been shown to generate three times as many leads.
Finally, many SaaS startups should measure their free trial signups. A secondary KPI to measure is customer acquisition cost or CAC.
Keeping track of these numbers helps with the next step—determining how well your content is generating revenue.
How to Gauge Your Content’s Revenue Generation
Each stage in your funnel leads to this final step—tracking how well your content efforts are bringing in profit and revenue.
In this stage, you’ll want to measure the dollar amounts each conversion and lead is bringing in.
To start, measure your sales-qualified leads. The exact factors that qualify a lead for sales will depend on your industry and sales process, but they generally include a decision-maker who is a good fit for your product and ready to buy.
With this information, you can also track the potential value of your leads. This turns an ambiguous number into something more concrete.

If you have a free trial of your product, track how many convert to a paid version of your program. You can also track additional sales metrics, such as upsells and cross-sells.
If you’ve had customers for a while, you can begin tracking the value of each customer. While their monthly recurring revenue may be a KPI for your business, the lifetime value of each customer is likely more important for the long term. Keeping track of these content performance evaluations brings us back to the lagging indicators we mentioned earlier—revenue and profit.
Analyze Previous Data and Repeat
Once you’ve evaluated your content across the entire funnel, you might think that you’re done.
And you are—for right now. But truly successful content teams know that the secret is to continually measure, test, and improve.
Why is this important? Because it’s a proven way to reach your goals.
According to research by Content Marketing Institute, 78% of marketers said their success was due to improved content, and 72% due to improved strategy.

To begin this process, compare your success at different parts in the funnel to your overall goals.
Pinpoint the areas that are already working, and expand them, either in their current stage, by transferring the same strategy to a different level of the funnel, or both.
For the areas that aren’t working, either revise based on what you’ve learned or cut them entirely.
And finally, always be experimenting with new strategies. As long as you keep a continuous feedback loop, there are never-ending possibilities to grow and improve.
Conclusion
Content can be a powerful tool—or a complete waste of time. It all depends on the strategies you’re using to keep it focused on what really matters.
To evaluate and improve your content marketing, first decide on your goals. Understand exactly what you’re trying to accomplish.
Next, work down the funnel with each stage. Understand how your content is attracting, engaging, and converting. These are your key content marketing metrics. Then look at how your content drives actual revenue day-to-day.
Finally, you’ll want to keep testing and improving. With each change, adjust and measure.
Building a winning content strategy isn’t about getting it right the first time, but continuous improvement.
Where will you start?
If you’d like to learn how to create better content faster.
Visit our blog.
If you know another marketer who’d enjoy reading this page, share it with them via email, LinkedIn, Twitter, or Facebook.