Core Web Vitals Overview: LCP, FID, and CLS
In mid 2021, Google gave SEOs and content marketers something else to worry about — core web vitals. For over a decade, the search engine has been telling us that page experience matters. Now Google’s algorithm incorporates a new page experience signal that also measures site speed and responsiveness.
Telling a developer you want a page speed score of 100 is like someone telling you they want to rank #1 on Google. That’s why having some knowledge of core web vitals goes a long way to making sure you get the results you want. This post covers:
- What core web vitals are
- Why they’re important
- How to measure them
- The options available to improve those metrics
I won’t go deep into the technical details. Rather, the goal is to give you enough knowledge to make sure the job gets done. Along the way I’ll share some lessons learned as I look to improve the page experience of the MarketMuse blog.
What are Core Web Vitals and Their Importance
Speed and responsiveness are critical factors in evaluating page experience, for which Google has developed a set of three quantifiable user experience metrics. Largest Contentful Paint (LCP) measures loading, First Input Delay (FID) measures interactivity while Cumulative Layout Shift (CLS) measures visual stability.

Note they’re not the only signals that make up Page Experience. But they form the core web vitals which I’ll be focusing on in this post.
But are they important?
In 2021, Google announced, “We’ll begin using page experience as part of our ranking systems beginning in mid-June 2021.” They go on to explain “while this update is designed to highlight pages that offer great user experiences, page experience remains one of many factors our systems take into account. Given this, sites generally should not expect drastic changes.”
So yes, they’re important in the sense that they’re a ranking factor. But the announcement doesn’t say how concerned we should be. Fortunately, Google Search Advocate John Mueller provides a little more guidance in this tweet.
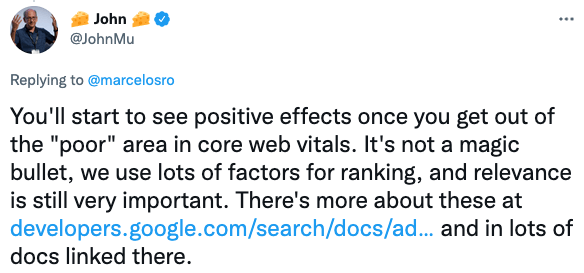
So, it seems that pages scoring poorly will benefit most from improvements to Google’s core web vitals. I’ll revisit this later when I discuss measuring and improving those metrics. First, let’s look at what these metrics are.
Largest Contentful Paint (LCP)
LCP calculates how long it takes a page’s main content to load. It’s a user-centric measurement because it marks the point where a user sees the majority of on-screen content.
Although the page will continue loading, a visitor feels like it’s already loaded because they see content on their screen. First Contentful Paint (FCP) and Time to First Byte (TTFB) highly influence the LCP score, even though they’re not part of Google’s core web vitals. That’s something to be aware of when looking to improve LCP.
First Input Delay (FID)
Loading a page quickly makes a great first impression — but the story’s not over. Once it’s loaded, visitors want to interact with the content. Depending on the page, that could involve:
- Scrolling
- Pressing a navigation button
- Choosing an option from a menu
- Filling in a field
- And any other interaction
FID measures how long it takes before a visitor can engage with the content on screen. A long delay has a profoundly negative effect, no matter how quickly a page may load.
Cumulative Layout Shift (CLS)
A fast loading page is great. Being able to interact with it without delay is even better.
But what happens when you go to press that navigation button, let’s say, and you end up clicking on an advertisement because of an unexpected layout shift? That’s very frustrating!
CLS measures the visual stability of the layout, so the above mentioned situation, or similar ones, don’t happen.
How to Measure Core Web Vitals
Google Search Console is a great way to monitor core web vitals. It’s convenient and easily accessible, so for that reason, it should be your go-to measuring tool. This report comes from the Chrome User Experience Report (CrUX data), which reflects actual usage as opposed to lab data.
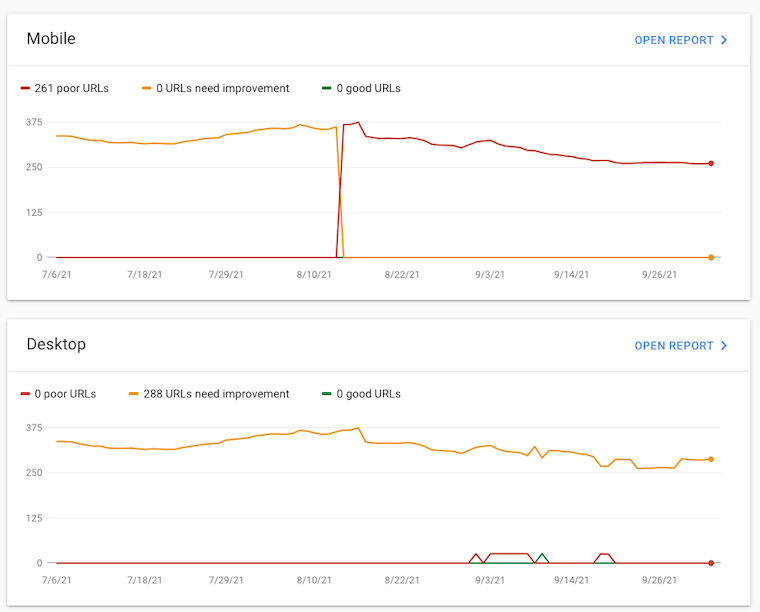
You can see how many URLs are poor, need improvement, or are good for mobile and desktop, separately. You can open the report for each segment to see the details as to the details of the issue including example URLs. Here you can also validate the fix with Google.
You should pay special attention to the mobile report as it has the most influence. In 2020, Google announced a shift to mobile-first indexing for the whole web. According to the company, that means “Google predominantly uses the mobile version of the content for indexing and ranking.” So, issues found in this report will have a direct impact.
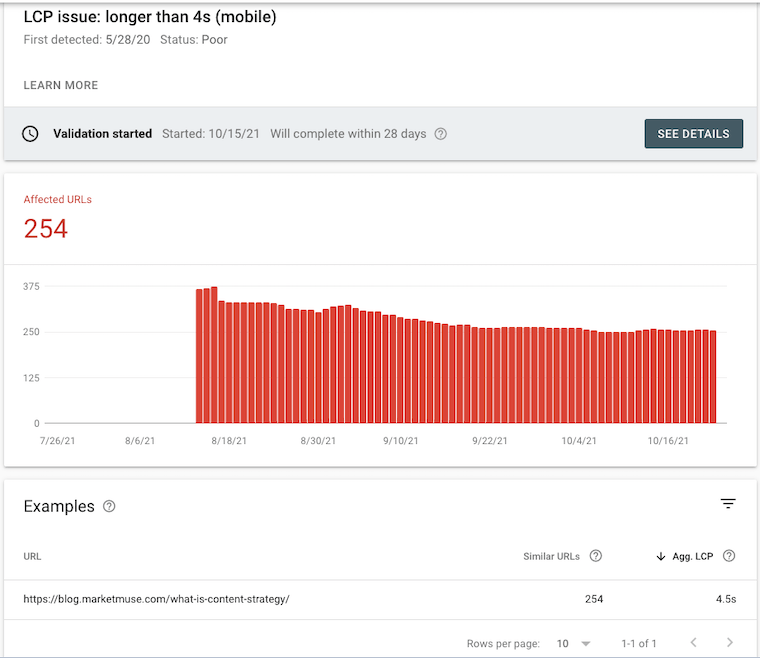
Note that Google Search Console only provides up to 20 similar URLs for each issue. In most situations, that’s fine. If you do want to examine the core web vitals of specific individual pages, then use Google’s Pagespeed Insights.
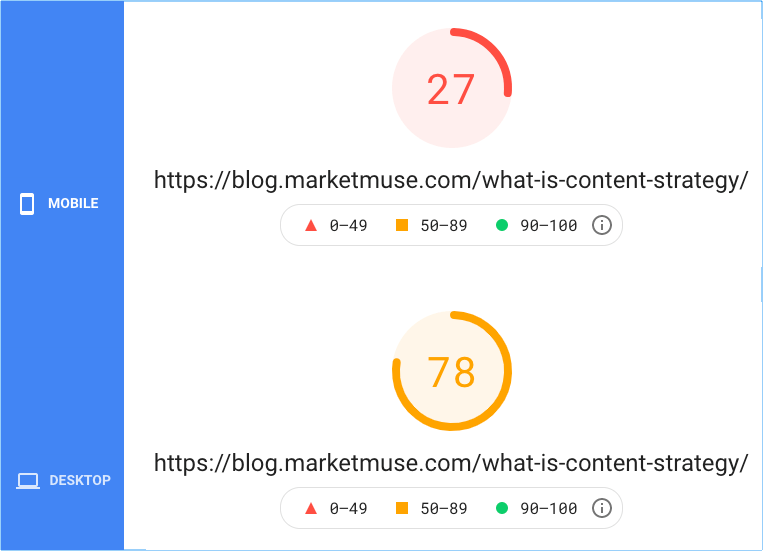
PageSpeed Insights provides information about both mobile and desktop devices. Since it’s much easier to perform well on desktop, and because Google uses mobile-first indexing, you should prioritize efforts towards fixing issues that affect the mobile experience.
Many people focus on performance score. However, that’s based on lab data collected by running Lighthouse as opposed to field data, which is what visitors experience. Take care of the issues as revealed by the field data and the performance score will take care of itself.
Note that Pagespeed Insights only displays field data if there’s been enough traffic to that URL within the last 28 days. How much traffic? Google doesn’t say.
Also, Lighthouse performance score can fluctuate due to changes in the underlying conditions including internet traffic routing changes, antivirus software, and more.
Interpreting PageSpeed Insights
Google records the value of each visits’ metric and places that result in a bucket. PageSpeed Insights displays the 75th percentile for each metric color-code — green = good, yellow = needs improvement, and red = poor.
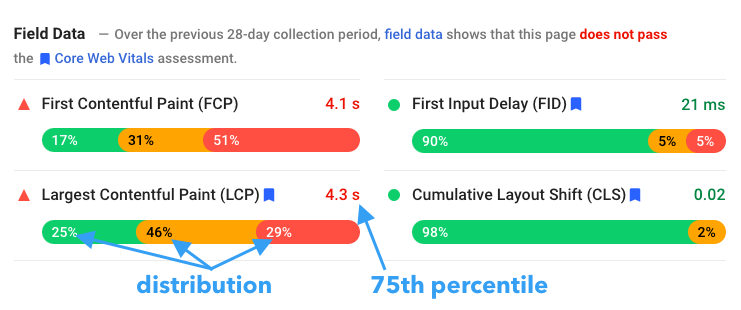
Percentiles indicate the percentage of scores that fall below a particular value. So in this case, 75% of all visitors experience an LCP of 4.3 seconds or less. Notice the display is red because it falls into the poor category.
Each metric also has a distribution bar divided into three buckets which are color-coded just like the percentile. In the example, 25% of the visitors experienced LCP that fell into the “good” bucket; 46% fell into the “needs improvement” bucket, and 29% fell into the “poor” bucket.
|
Good | Needs Improvement |
Poor | |
|
FCP |
0 to 1.8 s |
1.8 to 3.0 s |
Over 3.0 s |
|
FID |
0 to 0.1 s |
0.1 to 0.3 s |
Over 0.3s |
|
LCP |
0 to 2.5 s |
2.5 to 4.0 s |
Over 4.0 s |
|
CLS |
0 to 0.1 |
0.1 to 0.25 |
Over 2.5 |
These thresholds apply to both the distribution and 75th percentile.
Improving Core Web Vitals Metrics
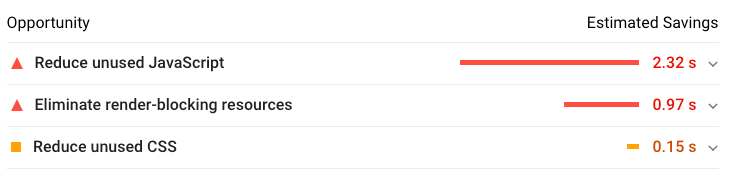
The biggest ROI comes from lifting the worst metrics (usually in mobile) out of the poor zone. In addition to providing insight into what needs improvement, PageSpeed Insights also offers suggestions to help your page load faster.
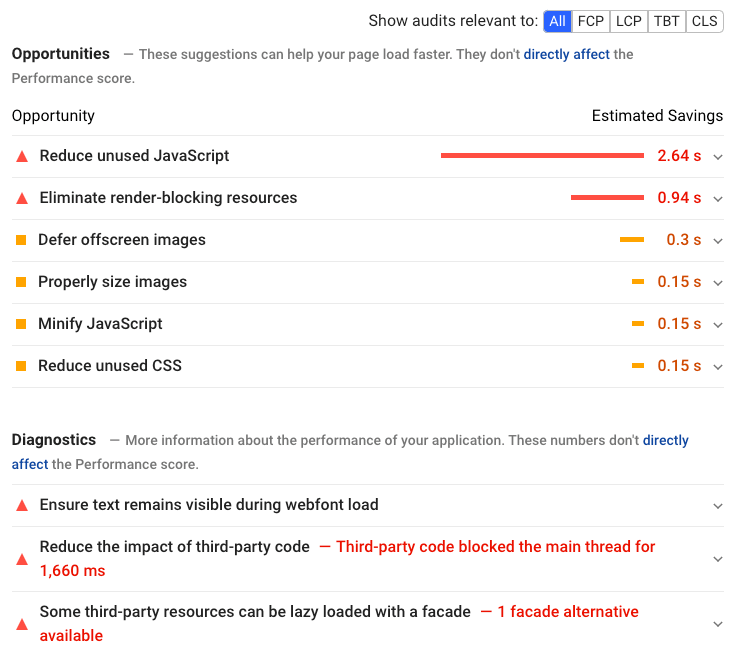
While there are many things you can do to improve your page speed, it’s best to prioritize those tasks that will have the most impact. That’s one of the advantages of using Google’s PageSpeed Insights — it provides a time savings estimate.
Let’s focus on some things you can do on the front end — that means we won’t have to touch the server. Even so, you may need development resources to accomplish some of these tasks.
Upgrade your hosting
Website host upgrading is a standard optimization that everyone always suggests – the idea being that a rising tide lifts all boats. But there’s a limit to how much of an improvement you’ll see.
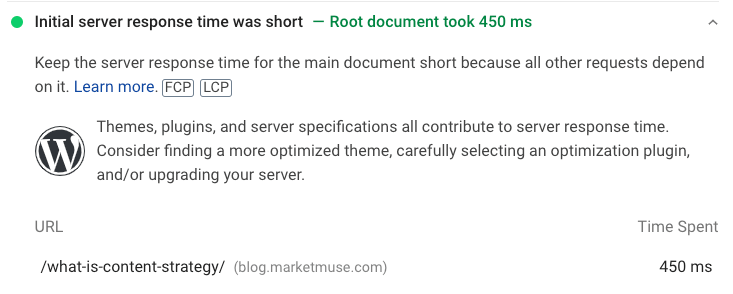
If the initial server response time is short, there’s no point in upgrading as that budget is better spent elsewhere.
Use a content delivery network
Consider this optimization if your audience is global. A content delivery network (CDN) is a group of geographically distributed servers that work to deliver content directly to wherever a visitor is accessing the internet. A CDN stores large static files, like images, and delivers them faster –— because they are physically located closer, there’s less waiting. All of this happens in the background without effort on your part. You just need to turn it on using your web host’s dashboard.
Optimize your images
If it isn’t already, make image optimization a part of your workflow. There are many online image optimization services that also offer a WordPress plugin –— that’s ideal for a set and forget implementation. Image size makes a big difference, so take the time to properly size images before uploading them to your content management system.
Use page caching
Page caching stores a static copy of a web page to serve it as fast as possible to a visitor. Even if your web hosting service comes with caching built-in, you may want to take a second look if you’re running a site on WordPress. WP Rocket is a caching plugin for WordPress that does a lot more, helping address some of the issues that PageSpeed Insights may raise.
Reduce the impact of third-party code
Third-party code can consume a lot of resources and the best action is to avoid introducing this wherever possible. Every time you add more functionality to your site (like a chatbot, social sharing button, video player embeds, or any WordPress plugin) another third-party script enters the picture.
In this case, less is better.
When we redesigned the MarketMuse blog, our developer removed a bunch of poorly coded Gutenberg blocks that were unnecessarily loading styles, and javascript on every page regardless of use. It turns out that not many blocks are coded properly, Kadence being one of the few.
But what if you just can’t live without that WordPress plugin, chatbot, or latest marketing tool?
WP Rocket can help address many of the issues arising from this situation, along with Asset CleanUp: Page Speed Booster, and Perfmatters (Script Manager feature). Basically, they help defer, delay or disable any third-party script as needed, eliminate render-blocking resources, and more.

Like I said, all that added functionality has a price.
The Takeaway
Web Core Vitals are here to stay and as SEOs and content marketers, we need to pay more attention to the impact they have on the user experience and ranking in search results. Although it’s disappointing to get a low score, the best opportunity for improvement is in optimizing the poorest performing metrics. You may be able to accomplish some of this on your own, especially if you take advantage of WordPress plugins. But some things can’t be fixed that easily — so you’ll need a developer to make some changes to your code.
Stephen leads the content strategy blog for MarketMuse, an AI-powered Content Intelligence and Strategy Platform. You can connect with him on social or his personal blog.