Understanding the Data Behind Your Traffic, Engagement, and Content Strategy
Jill Nicholson, Senior Director of Customer Education at Chartbeat and MarketMuse Co-founder and Chief Product Officer Jeff Coyle discuss using data to drive your content strategy. After the webinar, Jill spent time participating in an ask-me-anything session in our Slack Community, The Content Strategy Collective (join here). Here are the webinar notes followed by a transcript of the AMA.
The Webinar
Build an Engagement Strategy
Get the right data on how your audience engages with your content and use that to experiment and iterate. In this way, your content strategy is constantly evolving based on something that is tangible and not just “gut feeling.”
Understand From Where Your Traffic Comes
Retention trumps acquisition. It costs three times as much to acquire a new customer as it does to keep one. This should be reflected in your content approach. If your traffic comes predominantly from mobile, make it easier for them to consume the content from a user experience perspective.
Interpret Which Readers Are and Aren’t Engaging
Most visitors typically interact with less than two pages on a site. Two questions you should be asking yourself:
- How valuable is that reader?
- What can we do to get them to go to that second page and act with something else?
Increase Engagement Across Your Website
Take time out periodically to re-evaluate old content to determine how to best improve it. What links can you replace that are better? What facts and figures need updating? What topics can be expanded?
The AMA
What publications/thought leaders are at the top of your reading list?
Wow. I read a lot. Particularly news, since that’s my background and we work with some amazing news publishers. I try to keep that diet pretty diverse to get a range of perspectives. One newsletter I really enjoy at the moment is Ben Thompson’s Stratechery email.
How do you start constructing your onward visitor journeys?
I think you have to start by taking an objective look at your site from a reader perspective. How hard is it to discover more content? Then look at your metrics. How many content touches do you typically need to get someone to convert? It can give you a starting point and a goal so you can experiment
How have you seen leadership and editorial leads accelerate growth by grouping analytics information by site segment?
Definitely the ability to measure across sites. You may be duplicating efforts in areas you don’t have to. But, as always, it’s about learning across sites, and not judging.
I also think democratizing data is really important. Not everyone in the org is going to have full access to your central insights team. If you can outsource some data decisions, you free up time for your insights team to do more meaningful work, while your front-line teams can make more independent decisions.
How do you protect traffic/lead magnet pages? And how can you nurture another page to become one?
We mostly rely on regular cycles of evaluation, to make sure those pieces are in the best shape they can be. We also look back at our top performers whenever we make adjustments to our SEO strategy, to see if we can give them a little extra muscle. Revisiting these core pieces also tends to generate new content ideas, which also make for great related links.
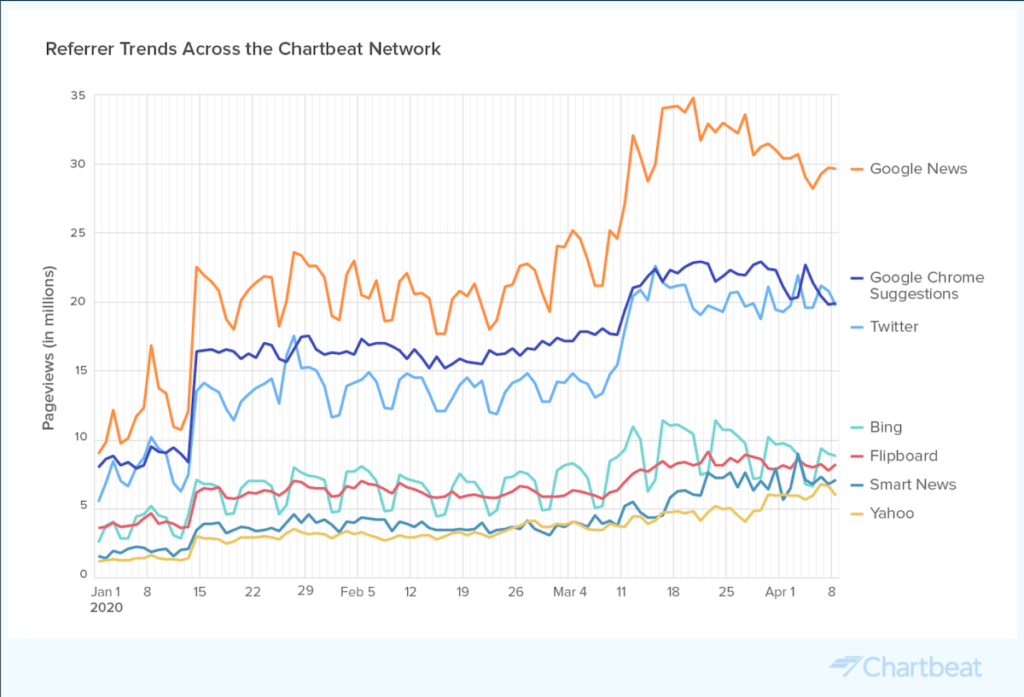
Can you talk more about Google Chrome Suggestions and how we can use Chartbeat to determine what traffic is coming from that?
The feature launched in 2018 with little fanfare, but the traffic referrals started growing rapidly. It’s a highly personalized experience, based on your previous browsing habits in Chrome. The interesting thing about GCS is that unlike other Google algorithms, it tends to recommend for evergreen content that some of the other environments like Google News.
We’re still learning more about this traffic source, but here’s an overview. In terms of measuring it in Chartbeat, you’ll see it listed as a referrer in your real-time dashboard in the right-hand rail. Here’s another resource about the full landscape of mobile aggregators and their recent growth.
Could you expand a bit more on “the rise of google” and what you’re seeing specifically?
When we look at external sources of traffic, Google search is by far the largest. In May, which was obviously a high traffic month due to COVID-19, the platform was driving more than 500 billion page views per day. That’s more than double the traffic we see from Facebook, the next-largest referral source. You can see the growth and ranking of the other Google environments on this chart.
How do you define and choose your north star metrics?
We have company-level north stars, and we try to tie our channel metrics to those growth goals. But at the end of the day, quality will always be my north star. Are people really reading the content we’re producing? If not, why are we doing it?
What data led to the decision for Chartbeat to release products for personalization and testing?
We’re focused much more on the optimization than personalization, though you can use our APIs for content recommendation. On the testing front, we knew how important headlines are to content performance, and we wanted to give creators a way to learn from their audience and build better best practices.
We launched our Headline Testing tool a few years ago, with some very careful methodology that rewards engagement after a click rather than just clicks alone. It’s become incredibly popular, and the data from those tests has let us learn even more about reader preferences on digital platforms.
I started my career as a news copy editor and headline writer, so I will never get tired of digging around in headline data. The most important thing that I learned was just how badly traditional headline writing practices resonate with digital readers.
Can you give some insight into creating a culture around testing, iterating, and welcoming failure?
The best thing to do is lead by example. Run your own experiment and be really transparent about what you learned. If you show your team that you’re willing to confront your own missteps and learn from them, they’ll be much more comfortable trying similar tactics in their own work. And always make sure you celebrate the misses. That’s how you learn. We have lots of case studies on how our customers have adapted to a culture of experimentation.
How have you used data to drive repurposing strategies other than the example you gave of the product release content on the webinar?
One change was design related. We had been using really big lead images, and we found that very few people were scrolling past them. It was an easy change to make and it really improved out scroll depth and engagement metrics.
We also needed to refocus on email subject lines to try to boost our open rates. We knew we could get good click-through once we had them there, but we needed to do a bit of experimentation on our subject lines and display text.
How do you think about off-site social traffic or conversations about your brand or your content? Is that possible to integrate into a content strategy or analytics?
We do think about offsite interactions, largely because they contribute to reach on social platforms. But because we have data that shows there is no correlation between what someone shared and what they actually read, my goal is always to drive our audience back to our owned channels.
How would you address direct traffic and dark social segments?
Chartbeat treats direct/dark social a little differently than other services. For us, direct traffic means that a reader typed in the URL or has the site bookmarked, which means a homepage or landing page. If a reader lands on an article page without a referral source, we know the link was shared somewhere, we just don’t know where it happened. We consider that Dark Social because those readers behave very similarly to readers from traditional social platforms.
In terms of traffic, we have a robust UTM strategy that helps us track readers’ sources, whether it’s the newsletter, paid campaigns, or partnerships. A clean and rigorous UTM strategy will save you a lot of time when it comes to analyzing the ROI on your content promotion strategies.
What do you do if your registered user behavior is wildly different from your organic traffic patterns? How do you bridge that gap with content?
That’s where I would pick apart the content itself to catalog all the differences in presentation and curation. Then, I’d create some content that meets in the middle and use those pieces to try to recirculate non-registered users.
Are there any interesting data and engagement trends or factoids that are specific to certain parts of the world?
The craziest pattern I’ve seen lately was in Italy. Before COVID, the majority of their news readership was happening on desktop, which is the opposite of what we see in the global patterns. Then the lockdown hit and the device trends reversed really, really quickly.
Stephen leads the content strategy blog for MarketMuse, an AI-powered Content Intelligence and Strategy Platform. You can connect with him on social or his personal blog.